To create a brand-new Partnership Impact Report (PIR) for your customer, please following the below steps:
Before a PIR can be created, the CSM must gain access to the customer’s booking engine, Google Analytics account, Search Console, Facebook (if applicable), and anything else that will need to be included in the PIR (ex. Instagram, Google Ads, etc.).
Then, the CSM needs to grant access to the MM and Reports@q4launch.com or Reports2@q4launch.com access to the aforementioned accounts.
Creating the report overview file:
- Log out of all of the Google accounts you're currently logged in to, and log in to whichever account was granted access to the aforementioned accounts: either Reports@q4launch.com or Reports2@q4launch.com using Keeper.
- Navigate to the Customer Reports Google Drive folder: *Q4Launch Master Folder > CSM > *Customer Reports
- Click New in the top left-hand corner to create a new Google Sheet.
- Title this sheet "[Customer's Name] Report Overview"
- Create the following columns (if the customer's package includes more than two e-mails per month, add additional columns to the below list):
- Date
- Current Year (ex. 2020)
- Previous Year (ex. 2019)
- Change
- Total Sends Campaign 1
- Total Sends Campaign 2
- Total Opens Campaign 1
- Total Opens Campaign 2
- Total Clicks Campaign 1
- Total Clicks Campaign 2
- In the Date column, insert the date for the first of each month of the current year (i.e. 1/1/20, 2/1/20, 3/1/20, etc.)
- Log in to the customer's booking engine and pull the booking revenue for the month being reported on and the previous 12 months (to establish a baseline for year-over-year growth), and update the two columns for the current and previous year's booking revenue within Report Overview file accordingly.
Creating the Partnership Impact Report (PIR):
-
- While still logged in to only Reports@ or Reports2@ as explained above, navigate to DataStudio.
- Find an existing PIR for a customer that you know has all of the services that your current customer has, and open that PIR. If there isn't a PIR that matches perfectly to what you need, find one that's close and find another PIR that has a page for what you're missing.
- Once the PIR that has all (or most) of what you need is open, click the button in the top right-hand corner for "Make a copy of this report".
- Then, click the Copy Report button. Once the copy of the report loads, click the Share button in the top right-hand corner and grant access to e-mail addresses for the CSM, CC, MM, Reports@, and Reports2@ accounts (both Reports accounts need access for a reason).
- Click the Edit button in the top right-hand corner, click Resource in the top navigation, click Manage added data sources, and remove all of the data sources that are shown.
- Click ADD A DATA SOURCE
- Click Google Analytics By Google. Select the customer's Account, Property, and correct View. Click the Add button in the bottom right-hand corner.
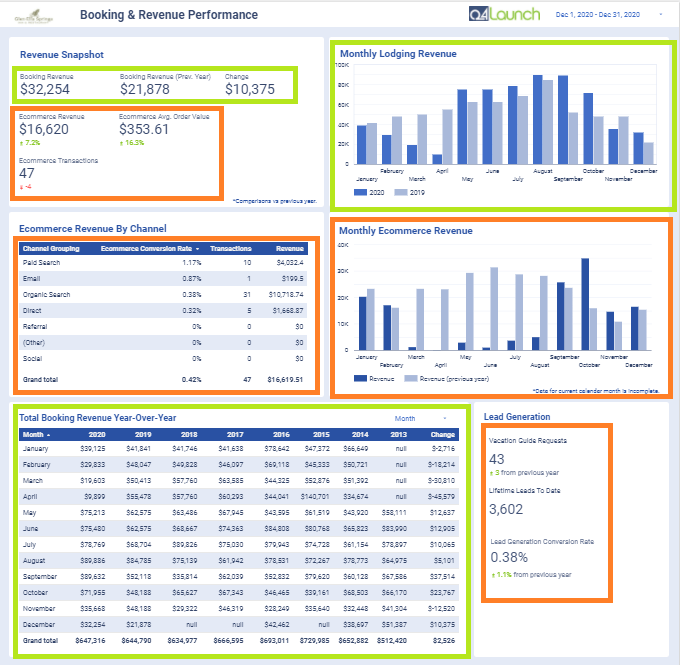
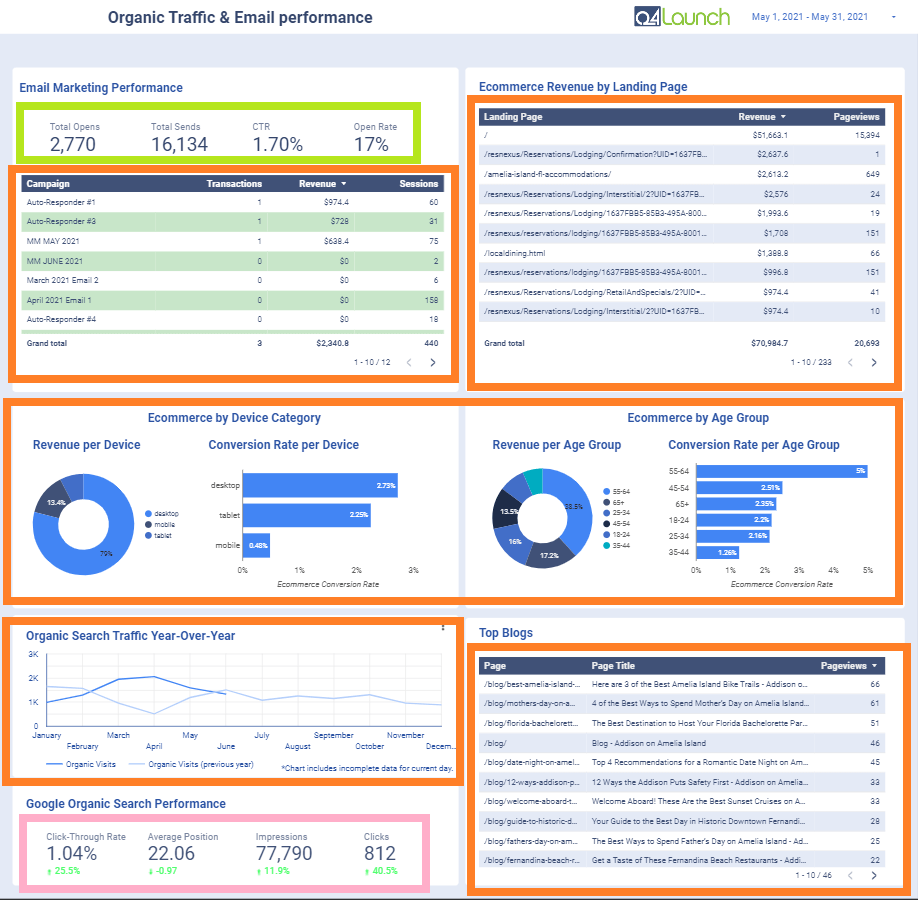
- Then, by referencing the 4 images at the bottom of this article, click each box that is outlined in Orange, and in the right-hand pane, click Select a Data Source and select the Google Analytics data source you just created.
- PRO TIP: If you hold the Control key while clicking, you can select multiple boxes and change the data source for all of them at once. This can only be done for boxes that have the same Data Source.
- Click Resource in the top navigation, click Manage added data sources, click ADD A DATA SOURCE, and click Google Sheets by Google. Navigate to the Report Overview file that you created earlier and copy the URL. On your PIR tab, click URL on the left-hand side of the screen and paste in the URL for the Report Overview file. Make sure the correct tab of the Report Overview file is selected in case there were multiple tabs, and make sure the boxes on the right-hand side of the screen are checked for "Use first row as headers" and "Include hidden and filtered cells." Click the Add button in the bottom right-hand corner.
- Then, by referencing the 4 images at the bottom of this article, click each box that is outlined in Lime Green, and in the right-hand pane, click Select a Data Source and select the Google Sheets data source you just created.
- Click Resource in the top navigation, click Manage added data sources, click ADD A DATA SOURCE, and click Search Console by Google. Find your customer's URL, select it, click Site Impressions, and click Web. Then, click the Add button in the bottom right-hand corner.
- Then, by referencing the 4 images at the bottom of this article, click each box that is outlined in Pink, and in the right-hand pane, click Select a Data Source and select the Search Console data source you just created.
- If your customer has Google Ads included in their package, click Resource in the top navigation, click Manage added data sources, click ADD A DATA SOURCE, and click Google Ads by Google. Select "Q4Launch Google Ads Manager Account". Then, select your customer's Google Ads account and choose "Overall Account Fields." Then, click the Add button in the bottom right-hand corner. Click Edit next to this newly added data source, click the words "Google Ads" in the top left-hand corner and add the customer's name to this title. Then, click the Done button in the top right-hand corner.
- Then, by referencing the 4 images at the bottom of this article, click each box that is outlined in Purple, and in the right-hand pane, click Select a Data Source and select the Google Ads by Google data source you just created.
- If your customer has Facebook included in their package, make sure you or the customer has granted Reports@q4launch.com Admin access to the Facebook page. If Reports@q4launch.com was granted direct access to the Facebook page instead of Business Manager access, you may need to use Keeper to log in to the Reports@q4launch.com Facebook account to accept the Page Admin Invitation from the Notifications section in the top right-hand corner of Facebook. Once access has been granted, log in to the Reports@ Google account (not the Reports2@ account) and open this new PIR. Click the Edit button in the top right-hand corner, click Resource in the top navigation, click Manage added data sources, click ADD A DATA SOURCE, and click Facebook Insights by Power My Analytics. In the Power My Analytics Hub drop-down, select "Q4Launch" and click Next. In the User Account drop-down select "Matt Launch (reports@q4launch.com)" and click Next. In the Page drop-down, select your customer and click the Add button in the bottom right-hand corner. Click Edit next to this newly added data source, click the words "Facebook Insights" in the top left-hand corner and add the customer's name to this title. Then, click the Done button in the top right-hand corner.
- If, for some reason, you don't see your customer's account in the Page drop-down menu but you know Reports@q4launch.com's Facebook account has access, please give it a few hours or check back the next day. Sometimes the list of available Facebook accounts takes a few hours to refresh.
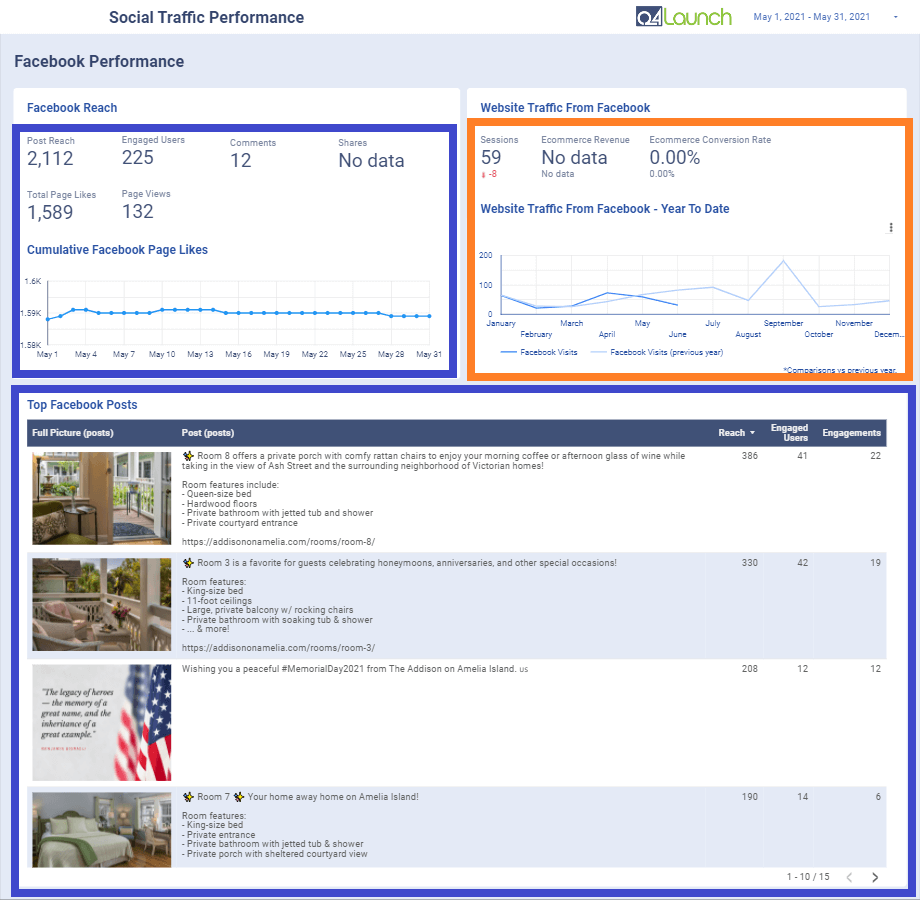
- Then, by referencing the 4 images at the bottom of this article, click each box that is outlined in Blue, and in the right-hand pane, click Select a Data Source and select the Facebook Insights by Power My Analytics data source you just created.
- Lastly, you'll need to make sure each of the following metrics is selected as follows:
- Post Reach = "Post Reach (pages)" metric
- Engaged Users = "Page Engaged Users (pages)" metric
- Comments = "Comments - On Post (posts, videos)" metric
- Shares = "Shares (posts)" metric
- Total Page Likes = "Total Page Likes (pages_lifetime)" metric
- Page Views = "Page Views (pages)" metric
- Cumulative Facebook Page Likes chart = "Total Page Likes (pages_lifetime)" metric
- Top Facebook Posts table:
- Photo = "Full Picture (posts)" metric
- Post Caption = "Post (posts)" metric
- Reach = "Post Reach (posts)" metric
- Engaged Users = "Post Engaged Users (posts)" metric
- Engagements = "Post Engagement (posts)" metric
- For Total Opens, Total Sends, CTR, and Open Rate in the e-mail data section, you'll need to create a metric for each if you're customer is sending more than one e-mail per month. To do so, click one of these boxes, select the Google Sheets Data Source that you created in Step 8 above, click Add dimension under Date Range Dimension, select Date, make sure Auto is selected under Default Date Range, click Metric, click Create Field, and follow the following steps for each box:
- Total Opens - Type "Total Opens" as the name. Then, in the formula box, manually type in the following formula Total Opens Campaign 1+Total Opens Campaign 2. Then, click Apply. Expand upon this formula accordingly if you have additional columns created because your customer is sending more than two e-blasts per month.
- Total Sends - Type "Total Sends" as the name. Then, in the formula box, manually type in the following formula Total Sends Campaign 1+Total Sends Campaign 2. Then, click Apply. Expand upon this formula accordingly if you have additional columns created because your customer is sending more than two e-blasts per month.
- CTR - Type "CTR" as the name. Then, in the formula box, manually type in the following formula (Total Clicks Campaign 1+Total Clicks Campaign 2)/(Total Sends Campaign 1+Total Sends Campaign 2). Expand upon this formula accordingly if you have additional columns created because your customer is sending more than two e-blasts per month.
- Open Rate - Type "Open Rate" as the name. Then, in the formula box, manually type in the following formula (Total Opens Campaign 1+Total Opens Campaign 2)/(Total Sends Campaign 1+Total Sends Campaign 2). Expand upon this formula accordingly if you have additional columns created because your customer is sending more than two e-blasts per month.
Data Sources Outlined For Each Page of the Report:
- Outlined in Orange below is the Google Analytics connector by Google.
- Outlined in Lime Green below is the Google Sheets connector by Google.
- Outlined in Pink below is the Search Console connector by Google.
- Outlined in Blue below is the Facebook Insights connector by Power My Analytics.
- Outlined in Purple below is the Google Ads connector by Power My Analytics.