
Google Search Console Information in Data Studio
The PIR includes a section with data pulled from Google Search Console. It looks something like this:
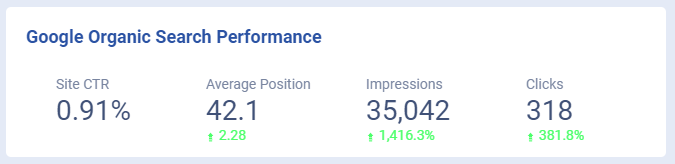
Below is a general description of each of the metrics above. This data is super high-level so I recommend digging deeper into Google Search Console to interpret what you’re seeing.
- Average Position: The average position of the site in search results. This is an average of all pages on the site for all keywords.
- Impressions: How many times a user saw a link to the site in search results.
- Clicks: How many times a user clicked through to the site.
- Site CTR (Site Click-Through Rate): The CTR is calculated by dividing the number of clicks by the number of impressions. (So in the example above, 318 / 35,042 = .0091 or 0.91%) It shows the percentage of impressions that resulted in a click.
The date range for this section is determined by whatever you have set in the top right-hand corner of the DataStudio sheet (highlighted below).

For average position, impressions, and clicks, you’ll see green and/or red percentages underneath each number:
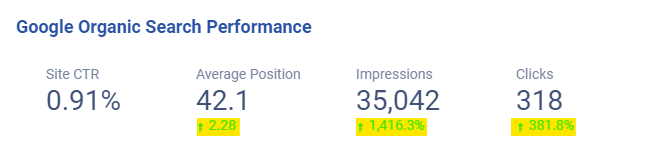
These percentages show a year-over-year comparison for each metric. For example, for the data above, compared to the previous year:
- The average site-wide ranking position increased by 2.28 positions
- The total number of impressions increased by 1,416.3%
- The total number of clicks to the website increased by 381.8%
It’s always a good idea to cross-check this data with what’s showing in Google Search Console.