
Before you can review how successful our marketing strategy is for customers, you need to understand what goals are set for each service. You can read that back on the article on creating a marketing strategy.
So, now that you have that refresher, how to go about reviewing how individual services are performing on behalf of customers?
Keep in mind that is simply a guide to find big-picture successes or failures on our part. Both then present opportunities for learning and continuous improvement.
Generally speaking, the process of diving deeper into data to understand what’s actually wrong and understanding where in our process needs attention is so unique to each customer that writing a guide would be extensive and overwhelming.
Overall Effectiveness of Q4Launch Services
We measure effectiveness of our marketing services by return on investment. As mentioned before, that’s measured in:
- Leads generated
- Online bookings
- Inbound phone calls to customers
While we can measure the first 2 in Google Analytics, we still need to look bigger picture to incorporate #3.
Most customers have and review a booking pace report. Booking pace, the rate in which reservations are made for the future, varies throughout the year. But keeping tabs on booking pace can ensure that we stay ahead of the year’s performance and continue to appear to be proactive in the view of our customers.
You can review the effectiveness of the individual services within Google Analytics.
Website Design & Development
Because website design and layout is so important to everything we do, most troubleshooting needs to start with reviewing effectiveness of our websites.
Within Google Analytics, check a couple windows. All images are 2017 results for an actual customer.
Online Bookings
Below is Acquisition > All Traffic > Channels, with a comparison of all traffic in 2017 versus 2016.
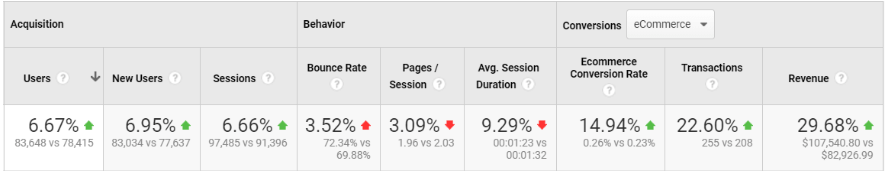 While YOY (year-over-year) data was an improvement, the conversion rate of 0.26% was so low we encouraged this customer to switch booking engines. We also updated their website.
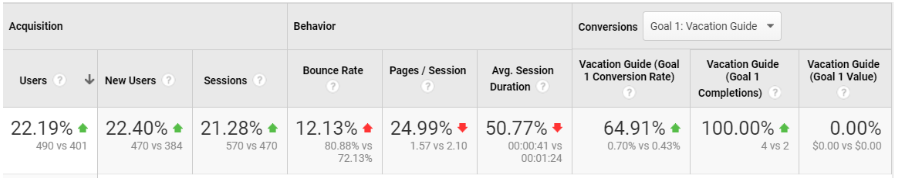
Now, the year so far in 2018 looks like this:
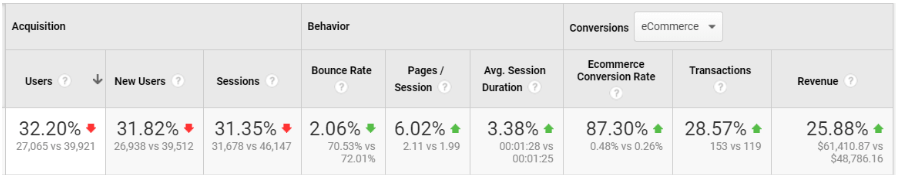 Our websites have less bearing on eCommerce transactions (since that happens on a separate product) in the B&B and hotel space, more so in vacation rental websites we manage.
But they do have bearing on behavior of traffic that visits:
- Bounce rate
- Pages viewed per session
- Average session duration
Low numbers in any of the above may be due to relatively simple to fix problems like a slow page load speed, or something bigger like a design layout that forces new visitors to scroll down below the fold on a page to get what they want.
Lead Generation
To review lead generation effectiveness on a website, follow the same process as above (Acquisition > Total Traffic > Channels), but switch the Conversions tab to whatever lead generation tracking goal you’d like to review.
Here’s the above customer’s data in 2017 again:
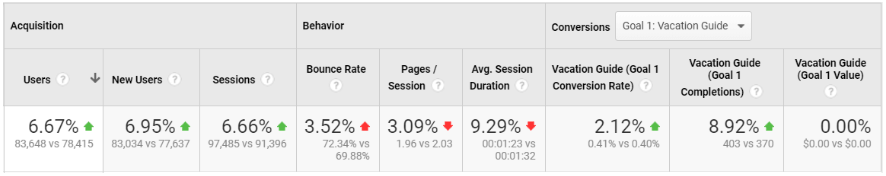 Some improvement YOY (year-over-year), but not as high as we’d like. Another reason we updated their website.
The goal with reviewing the website’s effectiveness first is to ensure that when we start attracting more traffic to customers’ website, a higher percentage of that traffic will convert to either a booking or a lead.
Now, on to reviewing the effectiveness of individual services.
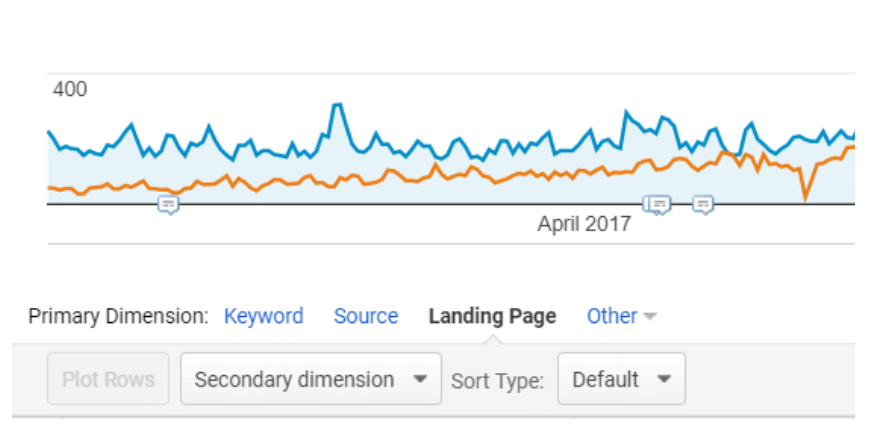
SEO
In Google Analytics, go to: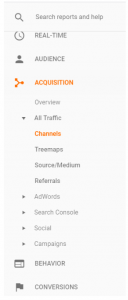
- Then click: Organic Search
- Change primary dimension from Keyword to Landing Pages
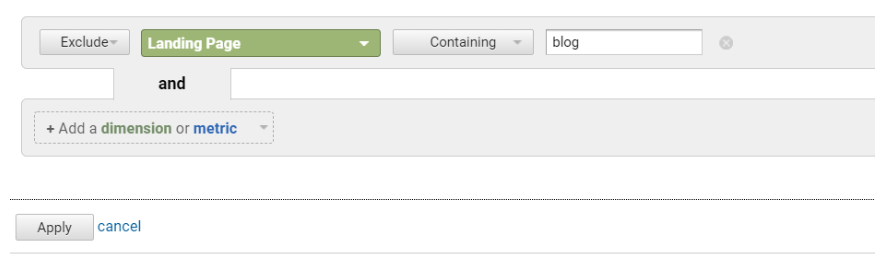
SEO focuses on static pages, so we need to do one more step to review their effectiveness:
- Click “Advanced” next to the search bar

- In the menu that comes up,
- Switch from “Include” to “Exclude”
- Keep the green button on “Landing Page”
- Keep the grey button on “Containing”
- Type “blog” into the white bar
- Your filter will look like this before you click the “apply” button:
With this view, you can see how non-blog pages are performing in terms of:
- Acquiring organic search traffic to the site
- How many leads and bookings result from those landings
- What percentage of that traffic is converting to leads and bookings
This view allows you to see results both across the website as well as on individual pages.
Be sure to look at some of the pages that typically result in the most bookings and leads:
- Homepage
- Accommodations
- Specials / Packages
- Things to Do
- Lead Generation squeeze pages
Online Bookings from SEO
Big picture, here’s how SEO performed for our example customer in 2017: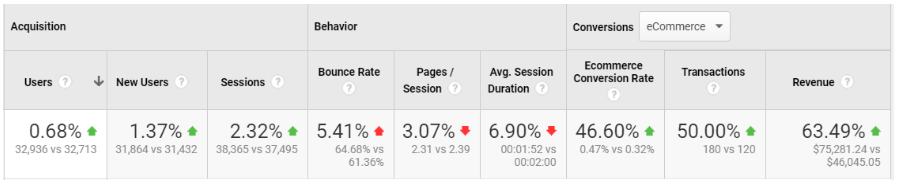
While traffic was up slightly, and bookings were way up, in this particular instance the poor behavior onsite lead to an under-performing end of the year in terms of traffic.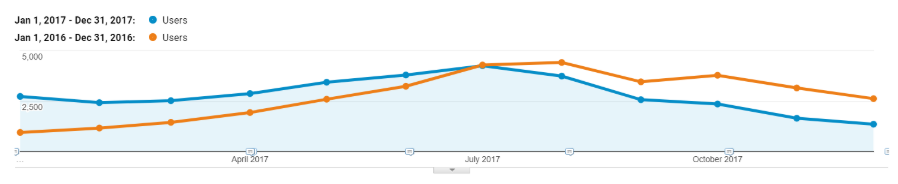
Poor behavior is a sign to Google and the other search engines that your pages are likely not a great solution or answer to whatever problem or question a searcher has asked the search engine. So those pages will start to drop in rankings.
Lead Generation from SEO
Switch the Conversions tracking tab from “eCommerce” to whichever lead generation campaign to measure how effective SEO was in generating leads for your customer.
Here’s the same customer:
😬
Blogging and Content Creation
Blogging works to attract traffic from multiple channels:
- Organic search
- Social media
- Email marketing
- Direct
- Referral
So the best way to get a broad view of how blogging is working is to look in:
- Behavior
- Site Content
- Landing Pages
Change your filter view to: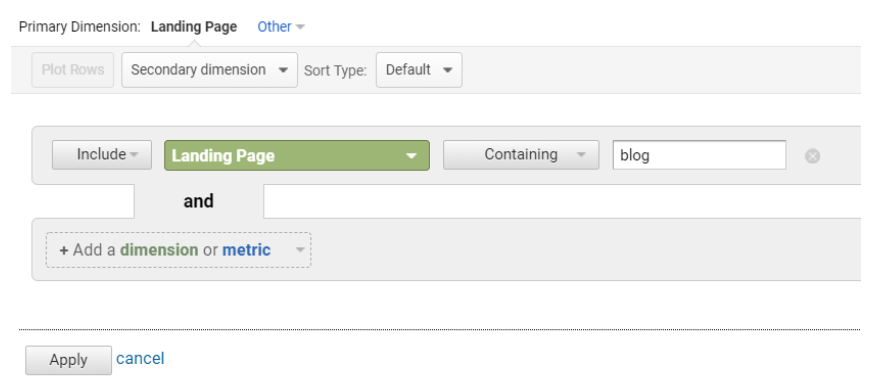
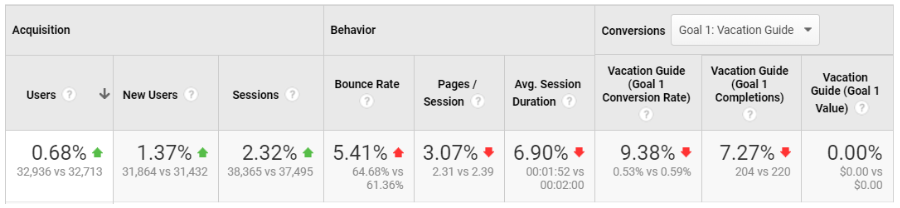
In this case of our example customer, blogging brought a lot of traffic in 2017. That said, the conversion rate was nowhere near our minimum goal of 1% of traffic converting to a lead:
In addition, the high bounce rate (best practice is in the 30s%), low pages per session and low average session duration (less than a minute is definitely not enough time to explore a site, let alone fill-out a form or book) raised red flags regarding long-term success for this customer.
😬
Social Media
Back to:
- Acquisition
- Total Traffic
- Channels
But this time, click “Social” to see traffic coming from this channel.
Keep in mind that Google Analytics includes source traffic from any website it considers a social platform. That includes but isn’t limited to:
- Yelp
- Google+
- Weebly
- Wikitravel
- Blogger
- TripAdvisor
So you need to review individual sources within this channel. That said, this view will lump source traffic from mobile, desktop, and tablet views from each of the above platforms.
A quick review of Social Media for our example customer would have looked great: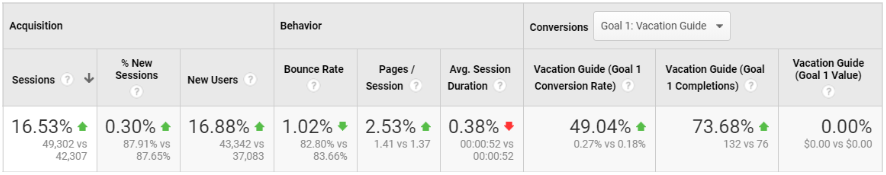
Look closer at the platforms we manage (Facebook and Pinterest), and things weren’t looking so rosy.
Generally leads are more easily generated from Facebook than actual direct bookings. But the conversion rate in 2017 was exceptionally low for our example customer: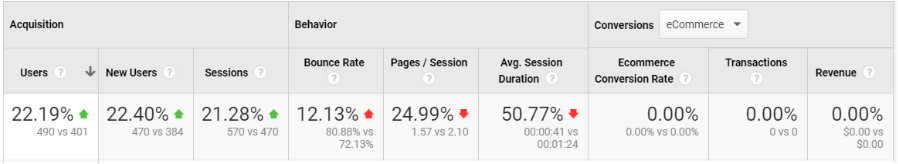
😬
Pinterest wasn’t looking much better in 2017.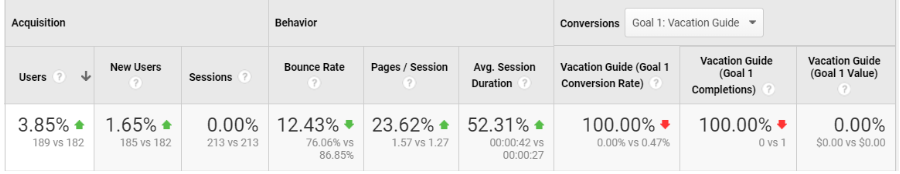
😬
PPC
Generally speaking, paid traffic from the search engines:
- Bing
Will behave similarly to organic traffic from the same search engines.
If you’re looking for a broad overview of how Paid Search is working, follow the above steps for Organic Search, but view “Paid Search” instead.
Here’s 2017 for a different customer from our previous example: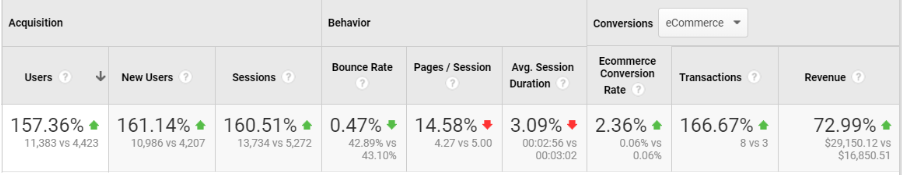
Revenue looks great, but the conversion rate is very low.
But PPC is not something to review at high-level. Individual keywords and campaigns may be severely underperforming, but that data may be hidden by the overarching success.
Look much deeper.
Email Marketing
Email marketing is all about generating or renewing interest in contacts on a customers’ contact list. So in terms of measurement in Google Analytics, that means:
- Leads generated (or that re-signify renewed interest by becoming a lead again)
- Phone calls resulting from email marketing campaigns
- Online bookings resulting from email marketing campaigns
We’re still working on a way to track phone calls from email campaigns. But the other two goals can be tracked in Google Analytics.
Follow the previous practice of:
- Acquisition
- Total Traffic
- Channels
Then go into either Email or (Other), depending on how email is tracking in your account.
- Email = MailChimp
- (Other) = GetResponse, for some reason
Here’s our example customer again in 2017: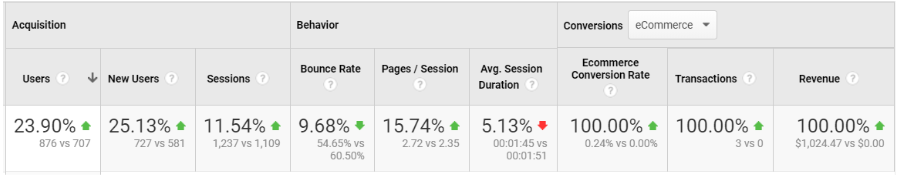
An improvement over last year, and the eCommerce conversion rate was in-line with the conversion rate of total traffic. So theoretically, improving that rate across the site would also improve email marketing.